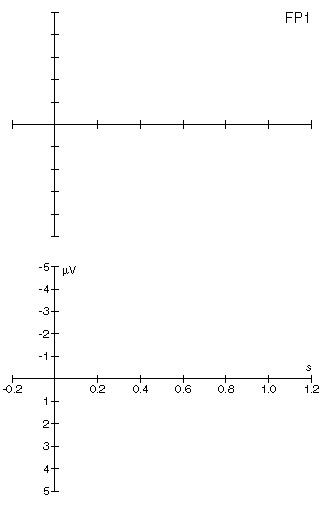
The following sample pictures have passed a long chain:
xavr -> PostScript -> xpsview image (2:1 scale) -> xv grabbed image
-> gif file -> your browser
You may find that some information was lost on the way...

|
[diagram template]
name       default
field      width:40 height:30
label      tsize:2
time_axis  unit:s   scale:1 pos:0.0 min:-0.2 max:1.2
ampl_axis  unit:uV  scale:1 pos:0.0 min:5.0  max:-5.0
time_div   step:0.2  len:1
ampl_div   step:1    len:1

[diagram template]
name       scale
label      thide:on
time_axis  fmt:"%s"
ampl_axis  fmt:"%s"
clear_div
time_div   step:0.2  len:1  fmt:"%.1f"
ampl_div   step:1    len:1  fmt:"%.0f"

[objects]
diagram  lab:FP1    x: 38.00 y:144.00 tpl:default
diagram  lab:SCALE  x: 38.00 y:110.00 tpl:scale
|
This is the most common "plain" case - the "default" data diagrams
are very simple (you have to arrange 60 and more of them at one page). There is
no axis text and only one division per axis - in the amplitude
(here: voltage) axis it is one line per ÁV, which results in 11 ticks for
the whole 10 ÁV axis.
Note that you reach a "negatives up" behavior by assigning the voltage minimum
to the axis maximum and reverse. (BTW, you cannot have a reversed time axis in
the current version).
Usually we need at least one diagram with axis descriptions. Therefore a
additional template named "scale" is defined. This template, as any template,
inherits all settings from the "default" template and needs only the differing
settings. The differences are:
- the new name "scale", needed to identify the template
- we want not to plot a diagram label, therefore we set
label thide:on
- the axes should plot their units, so we add the
fmt:"%s",
what means that the axis unit: text is plotted
- the divisions are new (we want to plot divisions with values now) so we clear the old
divisions and create identical new ones with a format string for the values
added.
To be continued...
