File - Load Average Groups - Directory Tree

Assume the following files are present (starting in the current directory)
pi08/a1rf/pi081.avr
pi08/a1rf/pi082.avr
pi10/a1rf/pi101.avr
pi10/a1rf/pi102.avr
pi11/a1rf/pi111.avr
pi11/a1rf/pi112.avr
pi12/a1rf/pi121.avr
pi12/a1rf/pi122.avr
pi14/a1rf/pi141.avr
pi14/a1rf/pi142.avr
pi15/a1rf/pi151.avr
pi15/a1rf/pi152.avr
pi15/a1rf/pi153.avr
pi15/xeog/pi151.avr
pi15/xeog/pi152.avr
You fetch in this tree with the settings:

'Load Average Groups' dialog

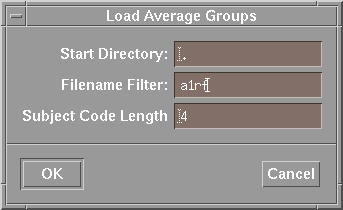
The last two files are skipped because their names do not match the filter expression. The available subject codes are built from the first 4 characters of the filename (pi08, pi10, pi11, pi12, pi14, pi15 ); the conditions from the rest of the filename ( 1, 2, 3 )

Since all matrix elements must be filled, the condition 3 is removed. Finally, the subjects are sorted alphabetically.

'File Group Selection' dialog

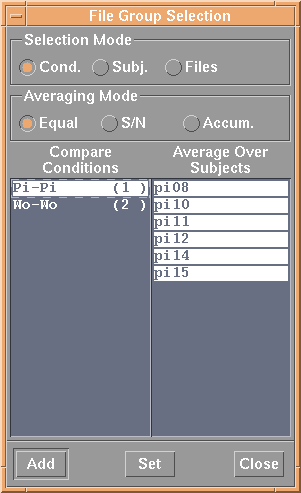
After all, you can choose between two conditions, each with maximal six subjects. Note that the file access informations are stored now for latter use. The application may (and certainly will) crash if something with the registered average files is changed!

It is possible to save this matrix as avraverage configuration file (File - Save Average Groups). Depending on the project size, network speed etc. it can be much faster to load such a file instead of scanning the tree again and again.

Select - Average Groups

The buttons in the upper part of the dialog controls the behavior as follows:

Selection Mode
Cond.
Calculate one grand average per selected condition from all selected subjects (default).
Subj.
Calculate one grand average per selected subject from all selected conditions
Files
No grand averaging. The ERP's for all selected subjects in all selected conditions are loaded.
(If a grand averaging over exact one subject, respectively condition, is requested, the single files are loaded. No single file grand averaging is performed)

Averaging Mode
Equal
The input average files are weighted equal during grand averaging.
xgrand = 1 / Nfiles * sumfiles(xfile)
S/N
The input average files are weighted with their Signal/Noise ratio.
xgrand = 1 / sumfiles(sqrt(N_trialsfile)) * sumfiles(xfile * sqrt(N_trialsfile))
Accumulate
Calculate the single trial average of all single trials in the input files.

EEP 3.1 - MPI/ANT(eeprobe@ant-software.nl), 20.05.1999
Copyright © 1996-99 Max-Planck-Institute of Cognitive Neuroscience. All rights reserved.
line endpoints ("butt", "round", "projecting") The linewidth parameter has effect for the screen drawing only if Options - Draw Wide Lines is enabled. Normally, all screen lines are 1 pixel wide (much faster). The PostScript output shows always the requested linewidth.

Textstyles

All text elements to be drawn are described by the following set of parameters:
  tcol:  color (a valid X color name)
  tfont: font (a valid PostScript font name - case sensitive!)
  tsize: fontsize (in mm)
  tx:    horizontal offset of text anchor point from text origin (in mm)
  ty:    vertical offset of text anchor point from text origin (in mm)
  tah:   horizontal text alignment relative to anchor point
         ("left", "right" or "center")
  tav:   vertical text alignment relative to anchor point
         ("bottom", "top", "center")
  thide: to enable/disable the text output ("off" or "on") 

Text box alignment The figure shows how the text box anchor point is displaced from the text origin coordinates and three of the nine possible alignments of the text box relative to its anchor point.

Fonts and fontsizes are evaluated exactly in PostScript output only, screen text is in (slightly different) screen fonts. Be exact in the fontname spelling, errors will occur at PostScript interpretation time only! Valid standard fontnames are:
  Times-Roman
  Times-Italic
  Times-Bold
  Times-BoldItalic
  Helvetica
  Helvetica-Oblique
  Helvetica-Bold
  Helvetica-BoldOblique
  Courier
  Courier-Oblique
  Courier-Bold
  Courier-BoldOblique
The thide attribute is somewhat special: it might be useful to have a text present (for object size calculations) but not to draw/plot it. Don't worry too much about it.

ERP Attribute Placeholders

In some contexts it is possible to use placeholders which are dynamically expanded with values from the actually loaded files. Valid placeholders are:
  &C  - condition label
  &N  - number of trials/averages
  &M  - mean number of trials of the input averages
        valid for xavr's on-line calculated grand averages only
  &R  - number of rejected trials
  &F  - filename
  &Sx - subject code (first x characters of the filename)
  &Tx - condition code (after first x characters of the filename)
  &I  - index of the file in the current selection
  &L  - channel label
These placeholders are also used to specify data selections. This is done using expressions of the form:
  sel:<placeholder(s)>=<literal>
  sel:<placeholder(s)>=/<regex>/
In conjunction with a diagram object, for example
  sel:"&I&L=/^[14]F/"
means that this diagram displays the signals from the first and the fourth loaded file which have a channel label starting with "F" ...

Templates

Global Defaults

Example

[global defaults]
page        width:297 height:210 grid:5
frame       type:eep hmargin:20 vmargin:9
trace_line  lw:0.25 lcol:black ldash:solid
scale_line  lw:0.15 lcol:black ldash:solid
text        tfont:Helvetica tsize:2
arrow       lw:0.40 lcol:black ldash:solid ang:30 len:3.5
This block describes a A4 landscape page with a 5 mm snap grid. A thin black frame line is generated. All signal data traces have a width of 0.25 mm. Other lines (diagram axes, axis divisions) are 0.15 mm wide, black and solid. Text is in Helvetica 2 mm. The arrow line defines the parameters which are used for interactively created arrows.

Reference

page
  width:  page width (in mm)
  height: page height (in mm)
  grid:   the snap grid spacing for interactive object placement (in mm)
frame
  type:   "eep" (a thin black frame) or "mpi" (a thick dark-blue frame)
  vmargin:
  hmargin: space between sheet edge and frame line
The frame settings are evaluated in PostSript output only. The screen just shows a dashed line to indicate it.

Diagram Templates

A diagram template is described by a large pile of parameters. Fortunately you'll never need to write them all, you can rely on a lot of defaults and need to supply only the differing settings. The following sections explain the full parameter set for reference purposes. The best approach is to start up with one of the sample configurations (xavr*.cfg) and to play around with this stuff. There are also some commented examples.

Example

[diagram template]
name       default
field      width:21 height:14
label      tsize:2 fmt:"%s"
time_axis  unit:s   scale:1 pos:0.0 min:0.3  max:0.6
ampl_axis  unit:uV  scale:1 pos:0.0 min:-5.0 max:5.0
time_div   step:0.2  len:1 fmt:"%.1f"
ampl_div   step:1 len:1 fmt:"%.0f"

Reference

field
  width:  width of the area covering all diagram parts (in mm)
  height: height of the area covering all diagram parts (in mm)
  sel:    channel/file selection
label
  fmt:    printf format string for diagram label output("%s")
  t...:   textstyle parameters for the label string plot
ampl_axis/time_axis
  unit:   unit string (e.g "uV" or "fT")
  scale:  size of the unit above in terms of xavr base units 
          (s for time axis, avr data units for amplitude axis)
  min:    value of left or lower edge of diag (in axis units)
  max:    value of right or upper edge of diag (in axis units)
  pos:    axis position (in units of the other axis)
  l...:   linestyle parameters for the axis line
  fmt:    printf format string for unit string output("%s")
  t...:   textstyle parameters for the unit string 
          (text origin is the upper/right axis end point)
ampl_div/time_div/ttest_div
  step:   spacing between division lines (in axis units)
  pos:    position of a single division/marker line (in axis units)
  len:    length of the division lines (in mm, 0 means whole diagram)
  align:  alignment of division lines relative to axis line
          ("center", "left", "right", "top", "bottom")
  l...:   linestyle parameters for the division line
  fmt:    printf format string for (float) value output ("%.3f")
  t...:   textstyle parameters for the value string
          (text origin is the lower/left endpoint of the division line)
ttest_line
  state:  enable/disable the running ttest prob. diagram("on" or "off")
  height: height of the diagram (in mm)
  min:    start point for probability drawing(in time axis units)
  max:    end point for probability drawing(in time axis units)
ttest_grey
  state:  enable/disable the prob. greyscale bar ("on" or "off")
  height: height of the greyscale bar (in mm)
  min:    start point for probability drawing(in time axis units)
  max:    end point for probability drawing(in time axis units)
  t...:   textstyle parameters for the greyscale legend of the 
          "scale" template (evaluated in PostScript only)
The default label position is (0;0) (lower-left corner of the diagram). The x-offset is fieldwidth, the y-offset is fieldheight, and the alignment is top-right. This means that the label appears in the upper right corner of the diagram field.

Axis division values are not permitted to cover axis lines and the spacing between division lines must be larger than 3 * division linewidth. Otherwise, nothing is drawn.

The probability axis of the semilogarithmic t-ttest diagram is hard-coded (min:1 max:0.001). Linestyle parameters are inherited from time/ampl axes. Divisions lines (ttest_div) are possible with pos only, not with step.

Map Templates

Example

[map template]
name         default
field        width:60 palette:bluered
time_axis    unit:s  scale:1 fmt:"&C: %.3f .. %.3f %s" tsize:2 ty:5
ampl_axis    unit:uV scale:1 min:-5.5 max:5.5
ampl_div     step:1 lw:0.2
outline      lw:0.2 
sensors      size:1 
legend       height:5 width:40 fmt:"%+.1f"

Reference

field
  width:    width/height of the square covering all map parts (in mm)
  palette:  color palette for amplitude (z-axis) encoding
            (the name of an own map palette or one of
             the predifined palettes "bluered","grey","mapview",
             "spectrum")
  sel:      file selection
  mesh:     for debugging; toggle drawing 0f the triangle mesh (0 or 1)
time_axis
  unit:   time unit string ("s" or "ms")
  scale:  size of the unit above in terms of xavr base units (seconds)
  fmt:    format string for map label output
          (printf placeholders for tmin, tmax and the time axis unit and
          ERP attribute placeholders)
  t...:   textstyle parameters for the label string
          (text origin is the map object position)
ampl_axis
  unit:   amplitude unit string ("uV" or "fT", "z" enables 
          z-standardization)
  scale:  size of the unit above in terms of average data units
  min:    amplitude value assigned to the lower end of the color scale
  max:    amplitude value assigned to the upper end of the color scale
ampl_div
  step:   the amplitude range represented by one color
  l...:   linestyle parameters for the iso... lines 
          (0 means no isolines)
outline
  l...:   linestyle parameters for the outline polygon
sensors
  size:   diameter of the dot which represents the sensor pos. (in mm)
  fmt:    printf format string for sensor label plot ("%s")
  t...:   textstyle parameters for sensor label plot
          (text origin is sensor position)
  l...:   linestyle parameters for sensor dot plot
legend
  height: height of the color scale legend
  width:  width of the color scale legend
  fmt:    printf format string for min/max amplitude values ("%.1f")
  t...:   textstyle parameters for min/max amplitude values

Map Palette

Description

A [map palette] section describes a sequence of colors which can be used in [map template] sections.

The first line defines the name of the palette. This line is optional. A palette without a name is used for all maps.

It is followed by a list of <color> [<coordinate>] pairs, where <color> can be any valid X color specification and the optional <coordinate> is the relative position of the given color (0.0 - minimum, 1.0 - maximum) in the generated palettes.

The actual palette colors are computed by linear interpolation of the red/green/blue components between these given supporting points. (Eventually, your display hardware gives you only approximations of the requested colors. You need to look at the final PostScript output then.)

Examples

[map palette]
name strange
rgb:00/f0/00  0.0
rgb:00/00/f0  0.2
rgb:00/00/ff  1.0

[map palette]
name bluered
blue
white
red

Legend Template

The [legend template] section instructs xavr to create line and text objects which together form a legend. This way you have a dynamic legend which explains the current view without any interaction. This can be disabled in the Options menu.

Example

[legend template]
headline    fmt:"Legend:" x:230 y:100 tsize:4.5
avr_entry   fmt:"&C (n=&N)"           tsize:3.5 len:6
diff_entry  fmt:"&s4 &c - &S4 &C"     tsize:3.5 len:6

Reference

headline
  fmt:    legend headline string
  x:      position of the legend headline text
  y:      position of the legend headline text
  dh:     horizontal distance between entries (in mm), default:0
  dy:     vertical distance between entries (in mm), default:-1.4*fontsize
  t...:   textstyle parameters for the legend strings
avr_entry/diff_entry
  fmt:    legend format string, subject to 
          ERP attribute expansion
  len:    length of the sample line segment (in mm)
  t...:   textstyle parameters for the legend strings

Style Template

The [style template] assigns individual linestyle parameters to selected trace lines in time series diagrams. It overrides the trace_line parameters in the [global defaults] section and the color which is stored in the avr files. It is overridden by the interactive trace style settings.

Example

[style template]
trace  sel:"&C=rare"     lcol:red  ldash:dotted
trace  sel:"&C=/^freq/"  lcol:blue ldash:solid lw:5
This would plot all ERP's with the condition label "rare" using red-dotted lines and all ERP's with a condition label starting with "freq" using 5mm-thick blue-solid lines.

Objects

Description

The [objects] section defines the drawing elements. If you want to see a diagram/map/line... in your drawing, you need to add a line to this list.

Since xavr allows interactive modifications of objects, it has to reflect such changes into the list. For this reason, whenever you have made such changes and enter the Edit - Configuration... dialog, xavr looks for the [objects] keyword in the file, throws away all stuff that follows and creates a completely new object list from the current internal state.

Therefore, the [objects] section has to be the last section in the file and should contain no special user formattings or comments!

Some object lines are generated as comments. Currently, this are the objects which form the legend. Since they are generated dynamically at each data loading time, it is not necessary to load them at layout creation time. If you are not satisfied with the automatic legend, you can comment out the [legend template], uncomment the legend objets and adapt them as needed. After this you have a static legend in the drawing.

Example

[objects]
text       x:148.00 y:185.00 txt:"Page Title" tsize: 8.00 tah:center
diagram    x: 38.00 y:126.00 tpl:default lab:FZ     
diagram    x: 38.00 y: 58.00 tpl:default lab:PZ     
maplegend  x:176.34 y: 26.46 tpl:default
map        x:172.00 y:108.00 tpl:default tmin: 0.200 tmax: 0.400 file:1
map        x:172.00 y: 38.00 tpl:default tmin: 0.200 tmax: 0.400 file:2

Reference

diagram
  x:
  y:      coordinates of the lower left corner of the diagram (in mm)
  tpl:    name of the assigned diagram template
  lab:    diagram label, the diagram will show the data for this channel
          if no sel:... is specified
  sel:    file/channel selection, overrides the template settings
map
  x:
  y:      coordinates of the lower left corner of the map field (in mm)
  tpl:    name of the assigned map template
  tmin:   start of the time slice for this map (in time_axis units)
  tmax:   stop of the time slice for this map (in time_axis units)
  file:   file selection
          (1 means: this map will show the first loaded/calculated file, 
           2 means: this map will show the second loaded/calculated file,
           ...
           0 means: this map will show the last loaded/calculated file)
  sel:    file selection, overrides file: and the template settings
maplegend
  x:
  y:      coordinates of the lower left corner of the
          map legend color bar(in mm)
  tpl:    name of the assigned map template
line
  x: 
  y:
  x2:
  y2:     coordinates of the line end points (in mm)
  l...:   linestyle parameters
  ang:    opening angle of the arrow head triangle (in degrees)
  len:    length of the arrow head triangle (in mm)
text
  x: 
  y:      coordinates of the text origin point (in mm)
  txt:    text string to be drawed
  t...:   textstyle parameters
epsf
  x: 
  y:      lower left corner of the illustration field (in mm)
  w:      width of the illustration field (in mm)
  h:      height of the illustration field (in mm); unspecified means
          fixed scale, height is computed from width and the EPS file 
          bounding box
  rot:    rotation angle for the included illustration (in deg); 
          unspecified means 0 or -90 (%%Orientation: Landscape)
  name:   name of a strictly conforming EPS file

EEP 3.1 - MPI/ANT(eeprobe@ant-software.nl), 13.07.1999
Copyright © 1996-99 Max-Planck-Institute of Cognitive Neuroscience. All rights reserved.
ld{load def